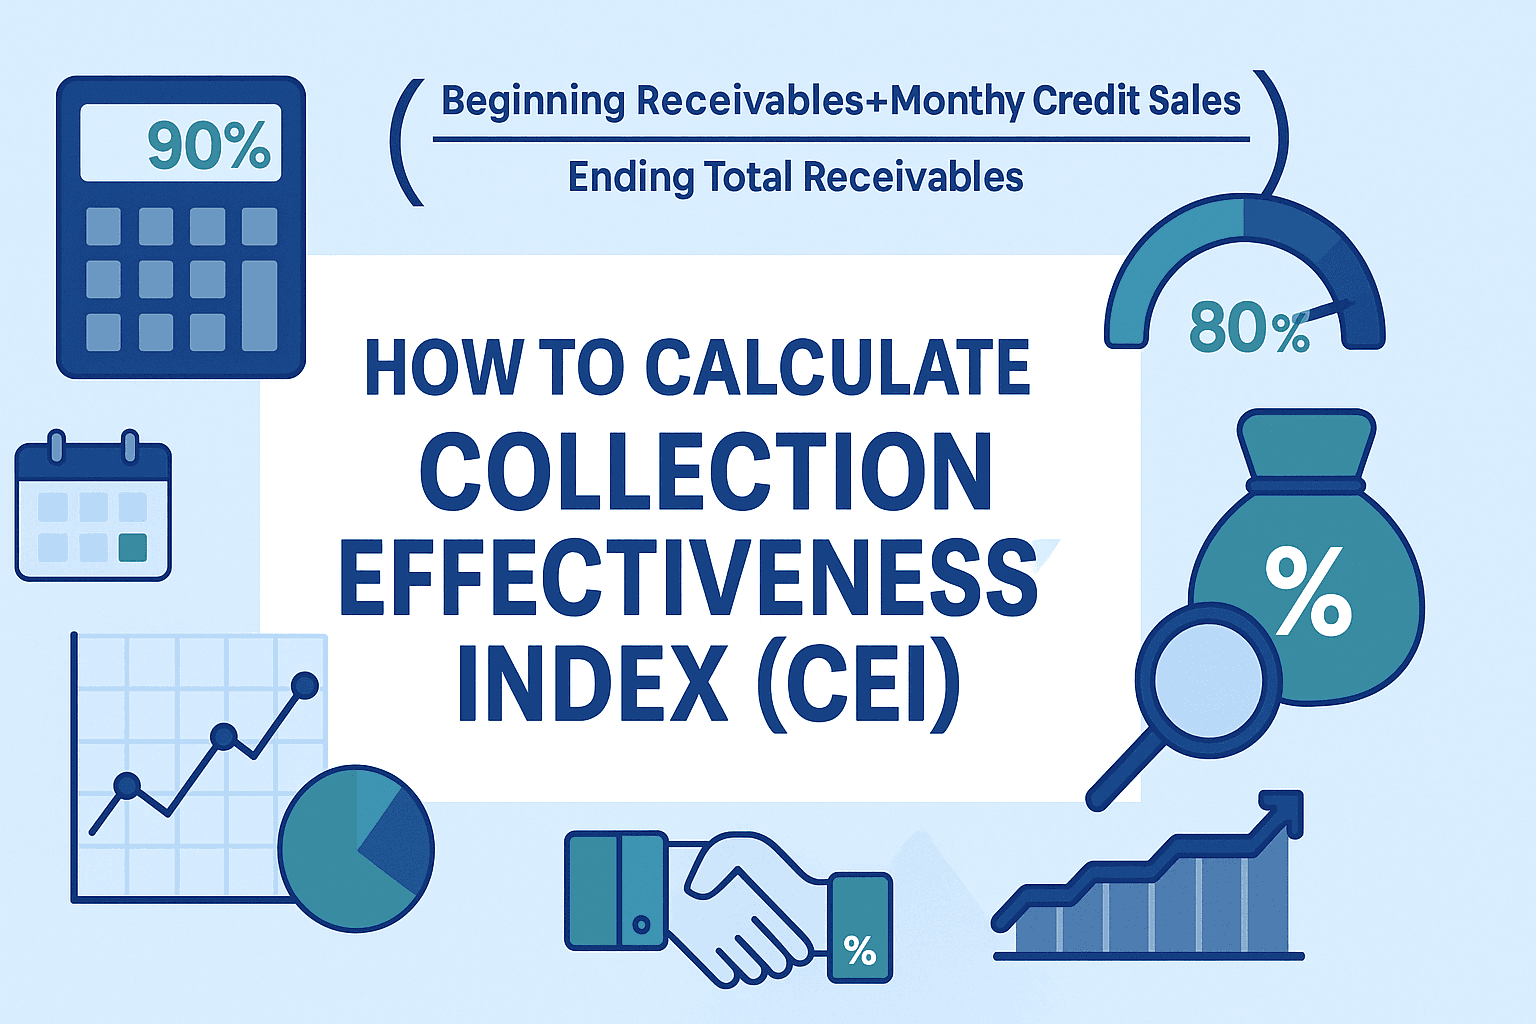
How to Calculate Collection Effectiveness Index (CEI)
Turning Pending into Paid Made for Indian MSMEs
The Collection Effectiveness Index (CEI) reveals how efficiently your business converts collectible credit sales into cash within a chosen period. Unlike Days Sales Outstanding (DSO), CEI ignores invoices that are still within agreed terms, giving a sharper view of your collection team’s performance.
1 What is CEI?
Definition CEI is the percentage of receivables that were actually collectible during the period and were successfully collected.
A CEI of 100 % means every due rupee was collected; 80 % means 20 % slipped past term.
2 The Formula
Opening AR — receivables at the start of the period
Credit Sales — invoices raised in the period (exclude cash sales)
Closing AR — total receivables at period‑end
Closing Current AR — portion of Closing AR still within credit terms
3 Step‑by‑Step Example (April 2025)
| Metric | ₹ Value |
| Opening AR (1 Apr) | 10,00,000 |
| Credit Sales (Apr) | 15,00,000 |
| Closing AR (30 Apr) | 12,00,000 |
| — of which still current | 4,00,000 |
Collected Amount (numerator) = 10,00,000 + 15,00,000 − 12,00,000 = 13,00,000
Collectible Amount (denominator) = 10,00,000 + 15,00,000 − 4,00,000 = 21,00,000
CEI = (13,00,000 ÷ 21,00,000) × 100 ≈ 61.9 %
Interpretation: Only ~62 % of the cash that should have come in during April actually arrived.
4 Benchmark Guide
| CEI (%) | Assessment |
| 95 – 100 | Excellent |
| 85 – 94 | Good |
| 70 – 84 | Average |
| < 70 | Needs attention |
Targets vary by sector—manufacturing firms may tolerate ≥ 85 %, while subscription SaaS aims for ≥ 90 %.
5 How to Lift Your CEI
Prioritise Early Reminders – Send friendly nudges three days before due.
Segment Follow‑ups – Focus calls on the 31–60‑day bucket.
Automate Dunning – Tools like PayAssured schedule escalating emails, WhatsApps, and credit holds.
Offer Friction‑Free Payments – Include UPI links or QR codes in every reminder.
Align Sales Incentives – Tie part of commissions to CEI or on‑time payment ratios.
6 Tracking CEI in a Dashboard
Quick setup: In Excel or Google Sheets, store monthly Opening AR, Credit Sales, Closing AR, and Current AR. Use formula cells to auto‑calculate CEI and plot a line chart.
Platforms like PayAssured pull data straight from your ERP and display real‑time CEI—no spreadsheets required.
7 Common Pitfalls
Including cash sales in Credit Sales—distorts denominator.
Counting disputed invoices as collectible—exclude until resolved.
Forgetting credit notes—use net Credit Sales.
8 Key Takeaways
CEI measures collection efficiency, not just ageing.
Calculate monthly; aim for an upward trend toward 85 % +.
Use automation, segmentation, and proactive outreach to close gaps.
A rising CEI means healthier cash flow and fewer borrowing costs.
Remember: High CEI shows discipline. Make it a board‑level KPI.