Payment Analytics for Business Decisions: Turning Numbers into Action
Turning Pending into Paid Made for Indian MSMEs
Invoices tell you who owes you money. Payment analytics tells you what to do about it—when to chase, where to tighten credit, and how to boost sales without risking cash flow. This guide shows Indian SMEs, in plain English, how to read key payment metrics and use them to make smarter, faster business decisions.
1. What Is Payment Analytics?
The practice of collecting, visualising, and interpreting data from invoices, receipts, and ageing reports.
Goes beyond simple totals—focuses on patterns, trends, and predictive indicators.
Implemented through dashboard tools in ERPs, spreadsheets, or platforms like PayAssured.
2. Core Metrics and Why They Matter
| Metric | Formula | Decision It Guides |
| DSO (Days Sales Outstanding) | (Total receivables ÷ monthly credit sales) × 30 | Overall collection efficiency; signals if terms need tightening |
| Current vs Overdue Ratio | Current bucket ÷ total AR | Health of credit portfolio; set reminder cadence |
| Average Payment Delay | Σ(days late × invoice amount) ÷ total invoices | Predicts cash‑flow gaps; plan working‑capital lines |
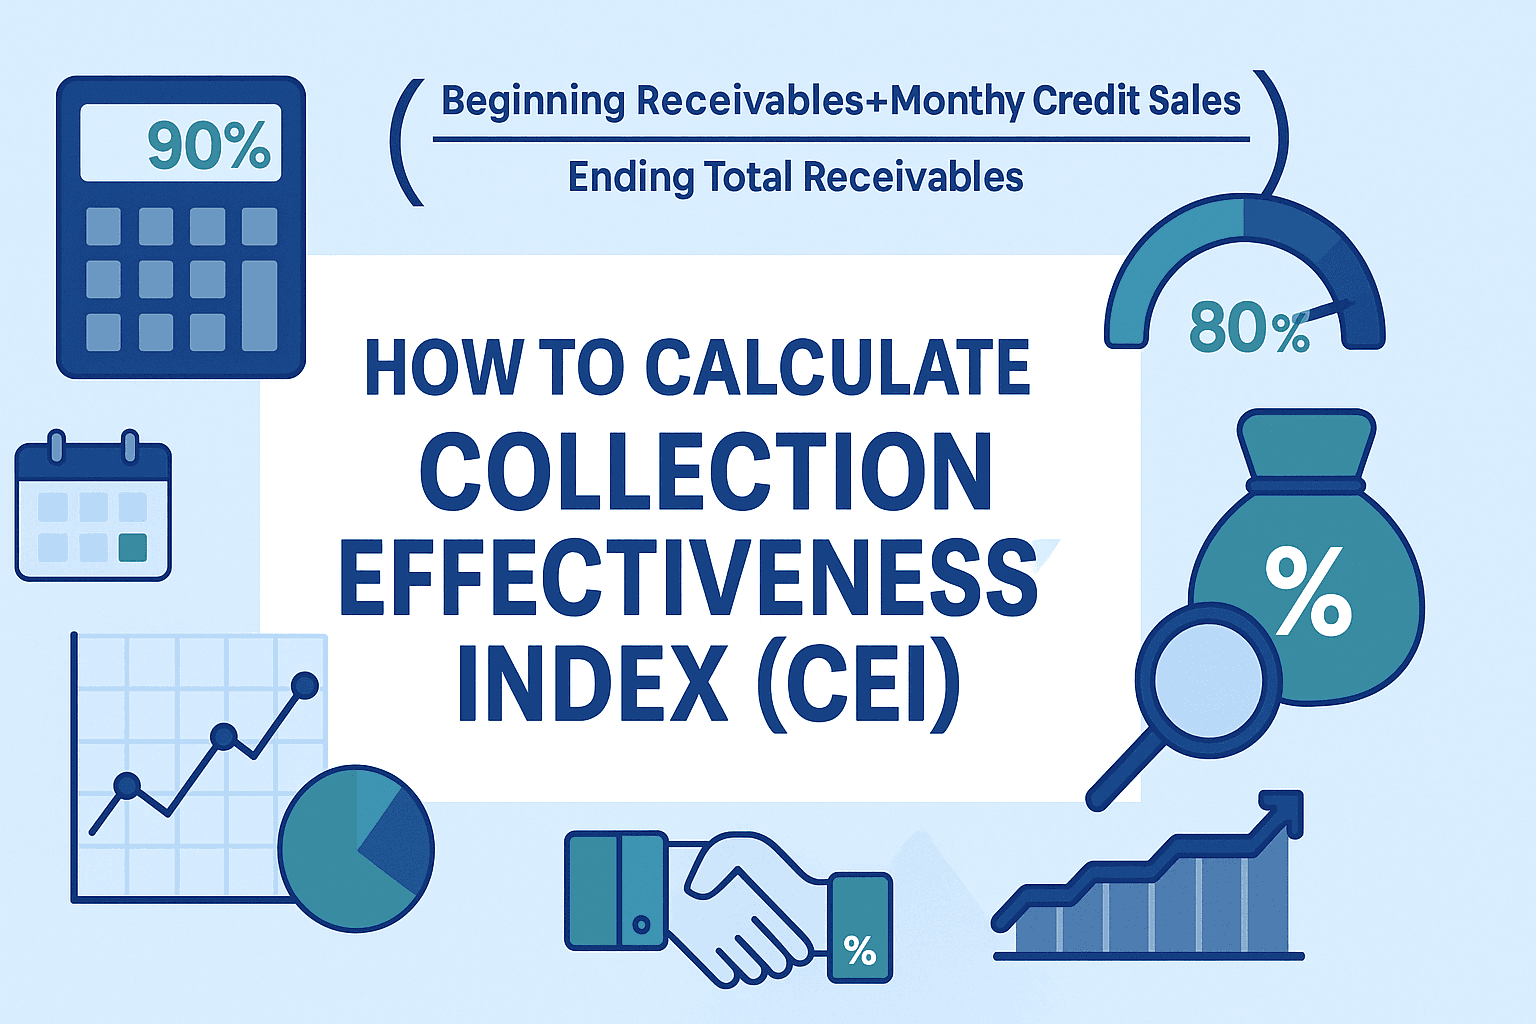
| Collector Effectiveness Index | Collected this month ÷ collectible (opening AR + sales − ending AR) | Measures collection team performance |
| Promise‑to‑Pay (PTP) Keep Rate | Kept promises ÷ total promises | Gauge reliability of customer commitments |
| Bad‑Debt % | Write‑offs ÷ annual credit sales | Input for credit‑limit policies & insurance decisions |
3. Visualising the Data
Ageing Heat Map: Colour‑code buckets; red zones draw immediate action.
Trend Line of DSO: Falling line means healthier cash collection.
Top 10 Risk Customers Chart: Highlights accounts with rising delays.
Collector Leaderboard: Friendly competition drives performance.
Most dashboards can be built in Google Data Studio or directly within PayAssured.
4. Using Insights for Business Decisions
Credit Limit Adjustment
Rising DSO + repeat delays → shrink limit by 20 % or demand advance.
Consistently early payer → consider limit boost to fuel sales.
Pricing Strategy
- Segment customers by payment behaviour; offer discount only to fast payers.
Working‑Capital Planning
- Predict next month’s inflows; arrange OD/discounting only if gap appears.
Sales & Collection Alignment
- Heat map shared with sales reps; they can nudge their accounts earlier.
Resource Allocation
- Focus collection calls on 61‑90 bucket where recovery chance is still high.
5. Automating the Workflow
Data Pull: Sync accounting software to dashboard daily.
Alerts: Trigger email/WhatsApp when a customer slips into a new bucket.
Playbooks: Pre‑set actions—e.g., auto‑send reminder template at 3 days before due.
Review Cadence: Weekly 15‑minute huddle using live dashboard.
6. Common Pitfalls to Avoid
Drowning in vanity metrics—focus on those that drive action.
Ignoring data hygiene—duplicate customer codes skew numbers.
Delayed data refresh—yesterday’s data loses predictive power.
7. Getting Started in Three Steps
List the metrics you need (start with DSO, ageing, PTP rate).
Set up a simple dashboard—spreadsheet pivot or free BI tool.
Define actions for each threshold—who does what when a metric flashes red.
8. Key Takeaways
Payment analytics transforms raw invoice data into strategic insights.
Track a handful of metrics—DSO, ageing ratios, PTP—to guide credit and cash‑flow decisions.
Visual dashboards + automated alerts = faster reactions and fewer surprises.
Consistent use of analytics via PayAssured or similar tools keeps your business one step ahead of cash‑flow shocks.
Remember: Data without action is just noise. Let payment analytics steer your next smart move.